Everything You Need To Know About Data Sampling in GA4
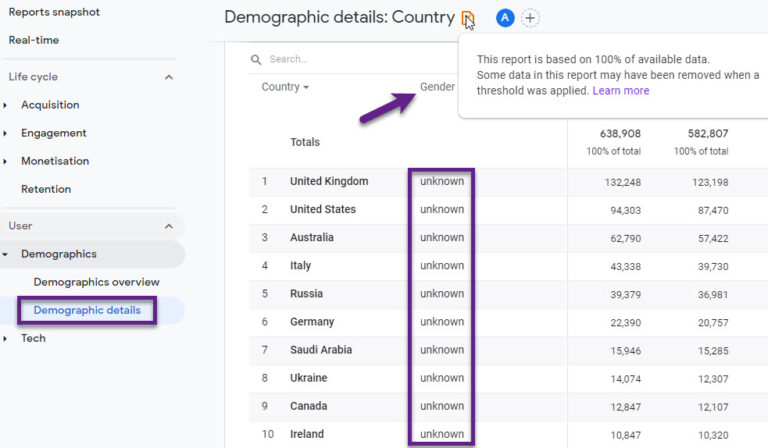
Data sampling in Google Analytics 4 (GA4) can sometimes cause confusion. When reviewing your reports in GA4, the presence of a green icon in the top right corner indicates that your report is unsampled. Conversely, if you see a yellow percentage sign, it shows the extent to which your report data is sampled. Let’s explore