Enter Google Analytics – a tool that has revolutionized the way we perceive our digital footprints. With its vast array of features, Google Analytics provides a comprehensive view of website traffic, user interactions, and a myriad of other essential metrics.
Among its many features, the concept of secondary dimensions stands out as a particularly potent tool for those looking to delve deeper into their data. But what is it, and how can it amplify your SEO endeavors?
Google Analytics: Your Digital Compass
Before we explore secondary dimensions, it’s essential to appreciate the broader landscape of Google Analytics.
Think of it as your digital compass, guiding you through the vast ocean of online user behavior.
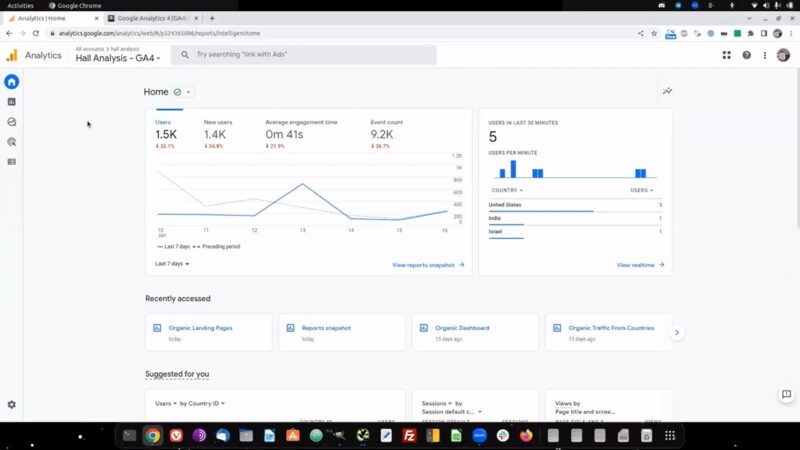
Google Analytics serves as an invaluable tool in the digital age, offering a comprehensive overview of how visitors interact with your website.
Tracking a multitude of metrics, allows you to see beyond mere numbers, delving into the deeper narrative of user experience and engagement.
For instance, it can reveal where your visitors are coming from, whether it’s through:
- Search engines
- Social media
- Direct visits
It shows how they navigate through your site, highlighting the pages they spend the most time on and the paths they take.
Secondary Dimensions
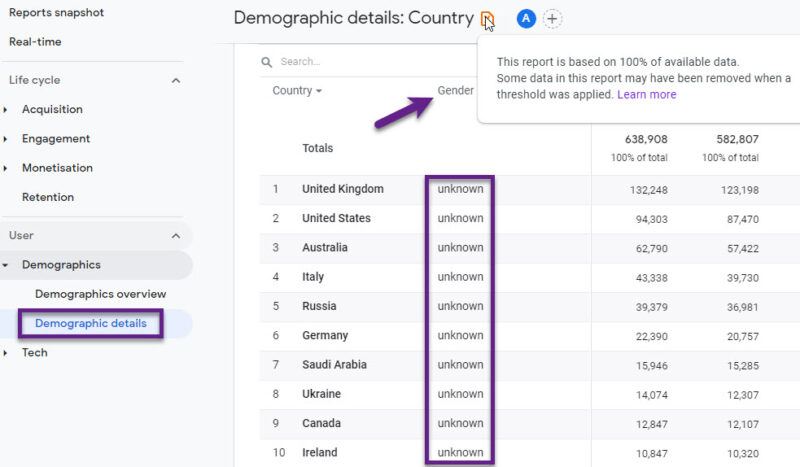
At a glance, when you open a report in Google Analytics, you’re presented with a primary dimension—a basic categorization of your data, like the cities your visitors come from or the pages they’ve viewed.
These primary dimensions offer a straightforward way to view and analyze your data, providing a clear snapshot of specific aspects of user behavior.
But what if you wanted to know more?
What if you wanted to understand the browsers used by visitors from a specific city or the campaigns that led them to a particular product page?
This is where secondary dimensions come into play.
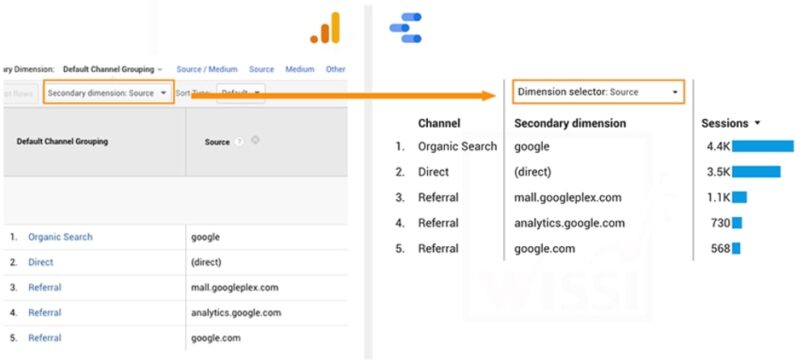
A secondary dimension allows you to pair an additional layer of data with your primary dimension, enhancing the depth and detail of your analysis.
It’s like having a magnifying glass that lets you zoom in on specific aspects of your data, offering a more nuanced and detailed view.
For instance, imagine you are analyzing visitor data with ‘City’ as your primary dimension. This dimension shows you where your visitors are coming from, such as:
- New York
- Los Angeles
- Chicago
While this information is valuable, adding a secondary dimension like ‘Device Category’ can provide even richer insights. With ‘Device Category’ as your secondary dimension, you can see whether visitors from New York predominantly use:
- Mobiles
- Desktops
- Tablets
Usage For SEO
Now, you might wonder, “That’s great, but how does this help with my SEO strategy?” The answer lies in the depth of insights you can extract:
- Content Optimization: By understanding the behavior of users from specific sources or devices, you can tailor your content to cater to their preferences, enhancing user experience and SEO.
- Targeted Marketing: Pairing dimensions like ‘City’ with ‘Traffic Source’ can help you understand which marketing channels are most effective for specific demographics, allowing for more targeted and efficient campaigns.
- Improved User Experience: By analyzing combinations like ‘Landing Page’ and ‘Device Category’, you can optimize your website’s design and functionality for different devices, leading to better user engagement and lower bounce rates.
Which Secondary Dimensions to Opt for?
In the intricate landscape of Google Analytics, the choice of secondary dimensions is pivotal to the depth and quality of insights you derive.
While the primary dimension offers a broad overview, the secondary dimension adds layers, revealing intricate patterns and behaviors.
| Dimension | Description |
|---|---|
| Source/Medium | Identifies the origin of your traffic (organic, social media, referrals). |
| Device Category | Shows users’ device preferences (mobile, desktop, tablet). |
| User Type | Differentiates between new and returning users for tailored engagement. |
| Campaign | Highlights the performance of various marketing campaigns. |
Expert Tips
These dimensions, when used effectively, can provide a wealth of insights, offering a deeper understanding of user behavior and interactions. To help you make the most of this feature, here are some expert tips for using secondary dimensions:
- Practice Restraint: While it’s tempting to delve deep and use multiple secondary dimensions, it’s essential to use them sparingly.
- Overloading your reports with too many dimensions can lead to confusion and make them challenging to interpret.
- Aim for Precision: The beauty of secondary dimensions lies in the detailed insights they offer.
- By being specific with your choice of secondary dimensions, you can gain more granular and actionable insights, allowing for a more refined analysis.
- Seek Answers: Before diving into secondary dimensions, have a clear objective in mind.
- What specific questions do you aim to answer with your data? Tailor your use of secondary dimensions to address these queries, ensuring your analysis is purpose-driven.
- Embrace Experimentation: The world of analytics is vast, and there’s always something new to discover.
- Don’t hesitate to experiment with different combinations of primary and secondary dimensions.
Final Words
Secondary dimensions are more than just an additional feature in Google Analytics; they’re the key to unlocking a treasure trove of insights.
By effectively leveraging these dimensions, businesses can transition from generic strategies to highly tailored approaches, ensuring every decision is data-driven.
While raw data serves as the foundation, the magic lies in the interpretation. It’s the patterns, the anomalies, and the trends that offer actionable insights.